Driving is a complex task that requires intense focus on the world around you. Distractions can be disastrous. Even quickly checking your text message can literally be fatal, but screens aren’t inherently bad! Many cars today have replaced physical gauges with digital displays, but most people would agree there is a fundamental difference between your relationship with your dashboard vs with your phone. I argue the reason for this difference is simple: the dashboard tells you exactly the information you need at a glance—no more, no less. You don’t need to spend valuable attention parsing unnecessary stuff.
Writing a thesis or paper is not quite as reactionary as driving, but it does require long periods of intense attention. Just starting a thesis writing session can be daunting because there are so many options at your fingertips when you sit down at the computer. Physically, you are only looking at one or two (or three) screens, but soon you have Overleaf open in one tab, and a paper in your library manager, the notes from your advisor in a third window, and the email and Slack notifications keep coming in! This is all to say nothing of the temptation to open social media or other distractions. Your fragile focus and motivation can be easily overwhelmed. Wouldn’t it be nice to have a Thesis Dashboard to look at? Something that quickly orients you to your current location and heading. A display that contains only the information you need to know, right where you expect it. I don’t know of any such thesis dashboard that exists, but it is not hard to make your own!
I submitted my PhD thesis the very day I am writing this blog. One of the best decisions I made during my PhD writing experience was making and maintaining a Writing Dashboard, and I want to extol the virtues of a Writing Dashboard to you.
My Writing Dashboard provides three benefits. First, I can see the status of my entire work at a glance. Just like on a car dashboard, it is important to summarize the big picture in a single visual field. Color-based conditional formatting is great for this—you just enter the status number and the corresponding color appears. In my Thesis Dashboard, each chapter and appendix had an associated status encoded with a number. Number 1 means not yet started, number 2 means substantially started, but not done, number 3 means done in rough draft, and number 4 means done in final draft. I later added a magenta color for number 5 which indicates that a committee member provided substantive feedback on that section, but I hadn’t yet incorporated their suggested changes.
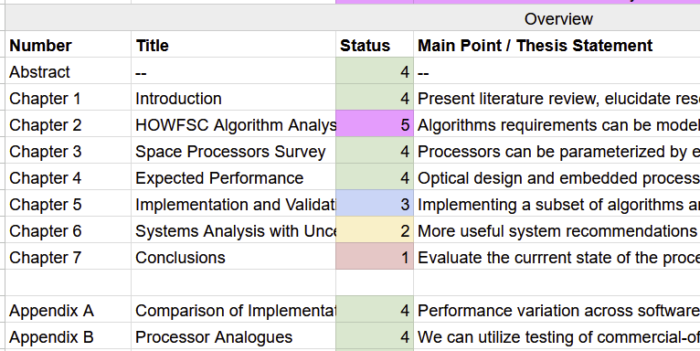
The heart of my dashboard is a color-coded status associated with each major section, chapter, or appendix. I also filled in a main point / thesis statement for every chapter.
For me, starting each writing session was the hardest part. The thesis is so long and there is so much writing to do! It can be overwhelming and lead to decision fatigue. Which section should I work on right now? This dashboard gets you up to speed in a glance and it is a medium for your past self to communicate high-level ideas with your future self. I included a Main Point / Thesis Statement for every chapter in my Writing Dashboard, so that each day, I could quickly remind myself of the chapter’s core message and ensure that all supporting details aligned with it. You begin to naturally ask yourself more tractable questions like: how does my most recent figure support the main point of this chapter? This enforced self-reflection leads to more concrete writing goals and ultimately a better thesis. Be sure to update the Main Points as your big picture understanding and contributions evolve!
The second benefit of a well-constructed Writing Dashboard is that it is an asynchronous communication medium between yourself and your advisor, committee members, or readers. When writing your thesis you want to solicit feedback from reviewers early, but you also don’t want them to waste their time by reviewing chapters that are still under construction. The dashboard quickly tells reviewers where you are in the process, and what type of feedback you want.
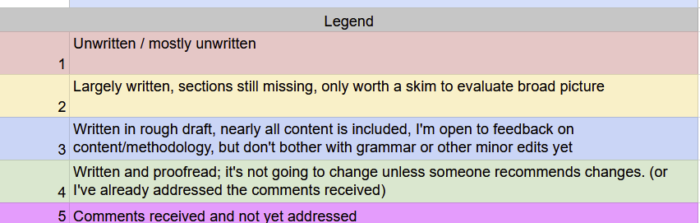
The writing status score helps you the writer, but also helps you communicate with your collaborators or reviewers. Each score is associated with a type of feedback you are looking for at that stage.
The final benefit is that the Writing Dashboard is as a reward to yourself and a concrete metric of your progress with a finite end goal. Ticking one of those boxes up from status 1 to status 2 is not just crossing off another item on your todo list, it is bumping the implicit progress bar a little closer to fully complete. In a spreadsheet, it is actually easy to turn this dashboard representation into an explicit progress percentage! The entire complex (i.e. overwhelming) task of writing a thesis is abstracted away to one simple and finite goal: make every square green! When using the dashboard, I’d open it up and tell myself something like “today I’m going to make Chapter 2 blue.” Then the rest of the day just follows. The exit criteria for the day is clear: Chapter 2 must be blue. The cadence for this sort of milestone is just about right for a good day’s work. It helpfully subdivides the month-scale milestones which we usually think about in committee meeting slides.
I’m sharing a simplified version of my writing dashboard on Google drive, but don’t take my version as gospel. The secret fourth benefit of making a thesis dashboard is that it forces you to arrange your own thoughts. Does my structure work well for where you are in the writing process? Does it support your interactions with your own committee? Would you add anything to my dashboard? Maybe you can use it to track feedback from committee members, or to arrange experiments, or to provide links to sources. Whatever format your dashboard takes, I’m willing to bet that the mere exercise of summarizing your status in a simple-to-parse display will pay dividends down the line as you finish your own work.