“What’s the scariest thing you’ve ever done?” With that simple question, former astronaut Chris Hadfield began what would become one of the most watched TED Talks of all time [1]. He didn’t start with equations or orbital mechanics. Instead, he launched into a story – recounting how he went blind during a spacewalk. In a room full of people expecting space trivia, he gave them suspense and humanity.
While Hadfield discussed technical topics like space station experiments, launch dynamics, and the forces acting on the shuttle during ascent, the audience stayed captivated because every technical detail was anchored in a story. This anecdote illustrates the often overlooked power of storytelling in technical presentations. Especially in fields like aerospace and astronautics where the concepts we work with can feel abstract or distant, storytelling is not a luxury, it’s a necessity. It’s how we bridge the gap between technical depth and human understanding, making our ideas not only heard, but remembered.
Why Storytelling Works
Technical experts often shy away from storytelling, worried it will seem too soft or not scientific enough, but neglecting narrative is a missed opportunity. Research shows that our brains crave stories – even us engineers. Research from Stanford professor Jennifer Aaker shows that stories are remembered up to 22 times more than facts alone [2]. Your groundbreaking result might be impressive, but if you wrap it in a story, it becomes 22x stickier in your audience’s memory.
It’s not just about memory; it’s also about making people care. Neuroscientists have found that when we hear a list of facts, only the language-processing parts of our brains activate. But when we hear a story, multiple brain regions activate – as if we’re living the experience ourselves. A narrative about designing a satellite to withstand the vibrations of launch by talking about the launch itself can trigger a listener’s sensory cortex (imagining the sight of a shaking rocket during takeoff) and motor cortex (feeling the vibrations and rumble of the liftoff). Our brains sync up with the storyteller’s brain patterns, a phenomenon called neural coupling, turning audiences from passive receivers into active participants. Stories also stimulate the release of hormones like cortisol (during tense, scary moments) and oxytocin (during emotional, heartfelt moments) according to neuroeconomist Paul Zak’s studies [3]. Cortisol focuses our attention; oxytocin helps us connect and empathize. So a well-told story biologically primes us to pay attention and care.
A classic experiment by Chip Heath at Stanford asked students to give one-minute persuasive pitches [4]. On average, students used 2.5 statistics in their talks, but only 1 in 10 students told a story. Later, the audience was quizzed on what they remembered. The result? Only 5% remembered any individual statistic, but 63% remembered the stories told.
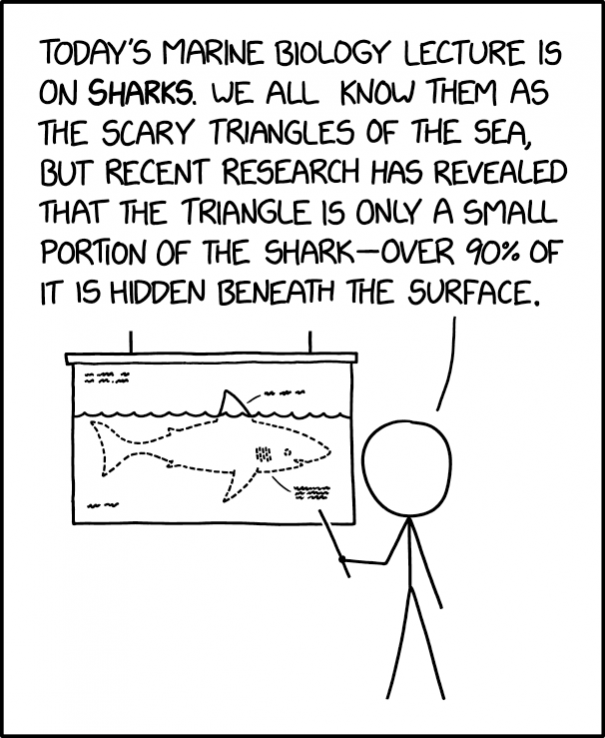
The presenter plays on well-known fear to create narrative tension, then resolves it with technical data, showing how stories activate emotional and sensory regions of the brain (from XKCD, all rights reserved by author).
Importantly, storytelling doesn’t mean oversimplifying things. It means making complex ideas resonate. In practical terms, when you present the schema of a story (beginning, middle, end), you’re aligning with how human memory naturally chunks information. We think in narratives all day – it’s how we remember what we did yesterday or plan for tomorrow. Tapping into that structure makes your technical content naturally more digestible.
Key Elements of Effective Storytelling in Tech Talks
Before you think about specific storytelling techniques, step back and plan the overall narrative. Every effective technical presentation should start by asking: What story am I trying to tell? Not every detail, but the high-level arc. Five key elements will help you plan your narrative:
- Setting the Context: Every story needs a setting. In a technical talk, this means orienting your listeners. Explain the background of your research or project – the “when/where”. Are we in a NASA cleanroom at 2 AM before a launch? A lab at MIT working on a coffee-fueled all-nighter? Set the scene so the audience enters your world. Context gives meaning to the data that will follow.
- Relatable Characters: Even in engineering, stories are ultimately about people. Your “characters” might be you and your team, a user of the technology, or even a personified rover or satellite. By giving your work a human (or humanoid) face, you invite the audience to care. It could be “our flight software lead who had to debug code on 3 hours of sleep” or “the anxious satellite waiting for a command signal”. As Nancy Duarte says in her book, “what people are really looking for at a presentation is some kind of human connection.” So introduce protagonists (and even antagonists, like “the stubborn problem” or “Murphy’s Law”) to drive your narrative.
- Conflict or Challenge: This is the heart of any story – something goes wrong or presents a hurdle that must be overcome. In technical terms, think of the problem your research tackles. Present this conflict clearly. It creates suspense and investment so the audience starts wondering, “How will they solve this? Will the lander make it?” No conflict, no story. Name the problem to make it clear why solving this challenge matters and what’s at stake.
- Keeping the Audience Curious: A great story keeps you on the edge of your seat. In a presentation, this means pacing your information to maintain curiosity. Don’t reveal everything at once. You can pose a question at the start (like Hadfield’s “What’s the scariest thing…?”) and promise to answer it by the end. Use analogies or metaphors as teasers (e.g., “Think of the plasma in a propulsion system like soup in a microwave; what might happen?”). One expert tip is to keep upping the ante: intensify the situation before resolving it. Maybe the first solution you tried failed spectacularly (more drama!), or your simulation crashed at 99%. This is the rising action. In technical terms, it’s walking the audience through the iterative problem-solving journey, making them eager to know the conclusion.
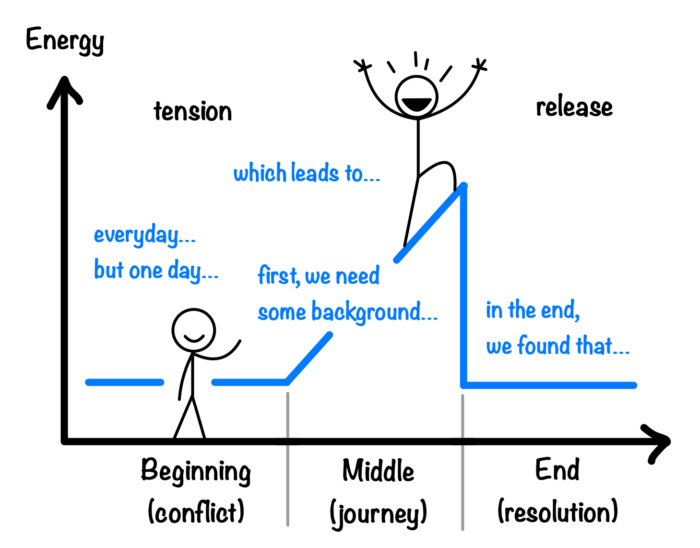
Build tension through controlled information pacing, guiding the audience through the reasoning process, adapted from the NSE Comm Lab’s Storytelling Workshop.
- Delivering Resolution Through Technical Content: Finally, every story needs a satisfying conclusion. This is where your technical content shines as the solution to the conflict. Explain how the challenge was overcome – how you fixed the engine cooling issue with a novel design, or what breakthrough insight your data revealed. This is the part where the audience learns the result and why it matters. Showing a resolution or ending is vital. It gives closure and often includes a call to action or key takeaway. In your case, the resolution might be “and that’s how we achieved a 25% efficiency gain” or “thus, we confirmed the spacecraft can survive a solar flare.” Deliver the technical meat as the resolution of the story, and it will feel earned and memorable.
By structuring your talk around these elements, you transform it from a list of findings into a narrative journey. You don’t have to overdo the theatrics; even a subtle narrative framework works wonders. Remember, you’re not just sharing what you did, you’re taking the audience on an intellectual adventure.
Weaving Stories into Data-Heavy Talks Without Losing Accuracy
“But wait,” you say, “my presentation is full of equations, charts, and multi-dimensional tensors. How do I tell a story with that?” Weaving storytelling into data-heavy content is indeed an art, but it’s entirely possible without sacrificing accuracy or rigor.
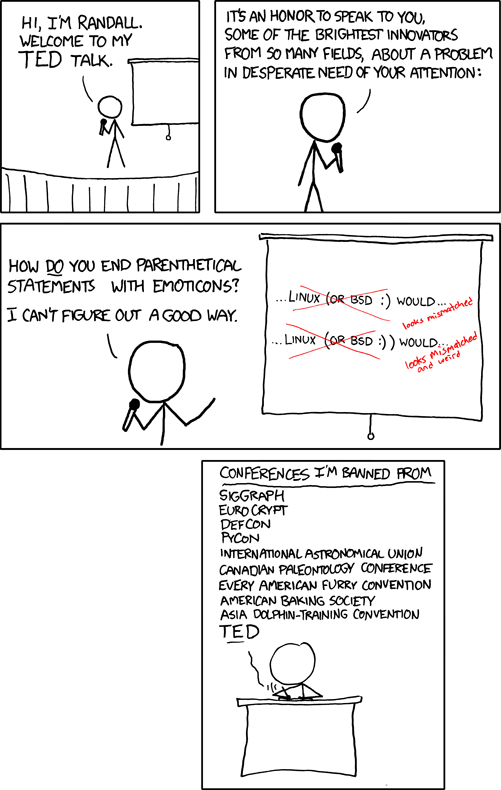
Leading with hyper-specific problems, no matter how interesting, risks confusing the audience if you haven’t first framed the bigger picture (from XKCD, all rights reserved by author).
Use metaphors and analogies as bridges: A well-chosen analogy can illuminate complex concepts. For example, aerospace engineers often compare spacecraft trajectories to throwing a ball or gravity as sailing with the wind. These metaphors turn abstract forces into something relatable.
The key is to pick analogies that are simple, relatable, and accurate. You don’t want to distort the science; you want to clarify it. If you’re explaining aerocapture, you might say, “It’s like threading a needle at 17,000 mph, we have to get it just right.” Instantly, the challenge is vivid, but you haven’t misled anyone about the physics. A good analogy can make a lightbulb go off in your audience’s head, as long as it stays true to the concept.
Humanize the data (and yourself): Data points can be characters, and so can you. Instead of “Data point X is an outlier on the graph,” perhaps “One aircraft in our dataset was the rebel, going against the trend.” By giving a sliver of personality or narrative to data, you avoid the monotony of pure stats. This doesn’t mean anthropomorphizing to the point of silliness, it means focusing on the story behind the data. Weaving in your own reactions like surprise, skepticism and persistence can also add a human layer. Sharing how you engaged with the data (“We thought it was an error at first,” or “I remember double-checking the result three times”) makes the analytical journey more compelling. By the end, the audience understands the data deeply because they followed its story arc.
Preserve accuracy with a reality check: When storytelling flourishes, periodically step back into your role as the scientist or engineer to reassure the audience of the facts. For example: “I’ll spare you the 12 pages of differential equations, but suffice it to say, the math confirmed what the story suggested.” This kind of aside keeps your talk grounded. Accuracy is your credibility – never let the story carry you into exaggeration or unsupported claims. Storytelling enhances data; it should not replace it or distort it. A good tip is to always have the detailed data available (perhaps in backup slides or a paper) so that you know your narrative shortcuts are all defensible.
Integrate visuals that support the narrative: Technical talks often have slides full of charts. Reframe your slides to serve the story: include a before/after picture to show the dramatic change, or a simple timeline graphic to visualize progression through your narrative. Visual metaphors can be powerful too, like an image of a bridge when introducing an analogy that connects ideas (just as we discussed bridging concepts). These visual cues reinforce the story elements (a rising line on a graph could coincide with the “rising tension” in your story, etc.). Just be cautious: visuals should clarify, not clutter. A well-placed diagram that everyone can read beats a dense table of numbers no one can see from the back row.

This example shows maps before and after frame alignment, giving a visual representation of the narrative progression from individual agents to a collaborative setting where their maps are combined [5].
ALT TEXT: Two drones each capture separate aerial views labeled “Individual UAV Views,” with red bounding boxes marking detected buildings. On the right, a single composite image labeled “Real-time Aligned View” shows the merged and aligned scene with consistent building labels.
By combining these approaches, you embed the story within the science. You might narrate a scenario (“Imagine you’re a satellite…”), use a metaphor (“It’s basically the Ferrari of rockets”), show a quick animation, and then back it up with the actual data without missing a beat. The narrative keeps the thread connecting those data points, giving them meaning and momentum.
Launching Your Message with a Story
In the world of aeronautics and astronautics, we’re trained to trust data, logic, and rigorous analysis (as we should!). But even the most groundbreaking discovery won’t make an impact if it doesn’t connect with people. Storytelling bridges the gap between technical complexity and human understanding. By setting context, introducing characters, posing challenges, inciting curiosity, and delivering resolutions, you turn your presentation into an experience rather than a lecture. The impact? Your ideas become memorable and meaningful. Your audience is not just hearing about your work, they’re feeling and experiencing it, if only for those few minutes.
Storytelling supercharges understanding because it engages both the head and the heart. As we saw, people remember stories far more than raw facts, and they’re cognitively wired to respond to narrative. For you as a presenter, that means your message doesn’t evaporate the moment your last slide leaves the screen. It sticks, it spreads (because who doesn’t love retelling a cool story they heard?), and it might even inspire action or further inquiry. As one Forbes article on leadership put it, “Science supports what great leaders have always known — stories are remembered up to 22 times more than facts alone.” In other words, if you want your technical message to hit its target, hitch it to a story.
Try incorporating storytelling into your next technical presentation. Start small if you want, maybe just a personal anecdote in your intro, or a metaphor to explain a tough concept. Observe the difference in how your audience reacts. Did those sleepy folks in the back suddenly perk up? Did your advisor actually smile (gasp!) at that analogy? You might be surprised at the power you’ve unleashed.
In the end, storytelling is not a gimmick; it’s a powerful tool in your communication toolbox. It’s the same tool that took humans from telling tales around campfires to inspiring generations through moonshot speeches. And it’s absolutely available to you for your next talk. As Chris Hadfield demonstrated on the TED stage, even the most technical journey can become a gripping story that enlightens and entertains. Your research deserves that kind of spotlight, and your audience will thank you for it.
References
[1] Hadfield, Chris. What I Learned from Going Blind in Space. TED Talk, March 2014. https://www.ted.com/talks/chris_hadfield_what_i_learned_from_going_blind_in_space
[2] Harnessing the Power of Stories. Stanford Women’s Leadership Innovation Lab, 2020. https://womensleadership.stanford.edu/node/796/harnessing-power-stories
[3] Zak, Paul J. How Stories Change the Brain. Greater Good Science Center, 2013. https://greatergood.berkeley.edu/article/item/how_stories_change_brain
[4] Heath, Chip, and Dan Heath. Made to Stick: Why Some Ideas Survive and Others Die. Random House, 2007.
[5] Thomas, Annika. Graph-Theoretic Object-Based Localization in GPS-Denied Environments. AirLab at Carnegie Mellon University Robotics Institute, February 2025. https://www.youtube.com/watch?v=fT6KLfiLAAw&ab_channel=AirLab