Criteria for Success
- Data are presented in a narrative flow with no logical leaps.
- Figures are designed to present results logically, and to support conclusions drawn in the discussion section.
- The narrative builds to a take-home message that is expanded on in the discussion section.
- [Optional] Explain data or observations that cannot be effectively conveyed in graphical form.
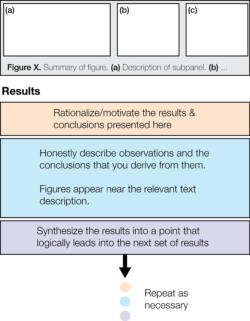
Structure Diagram
Also, compare Authentic Annotated Examples for Methods [link] and Results.
Purpose
The goals of your Results section are:
- to describe and explain the data that you obtained with your methods, as objectively as possible and in a narrative form, and
- to communicate a take-home message based on those data.
While your figures give your readers the opportunity to examine your data and draw their own conclusions, the Results section offers them more support for interpreting data by explaining experimental logic, highlighting important data features, and stating your conclusions.
Moreover, some information about what you’ve observed cannot be summarized well in a figure, table, or diagram, even though it is important to convey. Therefore, use your results section to describe this information in the text, in a way that supports your main points.
Speculation and extended interpretations belong in the Discussion [link], not in the Results.
Note
Some journals combine their results and discussion sections. This approaches can be advantageous because it allows the authors to explain their data and immediately follow up with a discussion of the data’s relevance, its relation to other data in the field, and the broader conclusions that the data support. Critics of this style, however, may prefer all of the data be presented ‘as-is,’ in a single section so that readers can develop their own conclusions first. Whether you have a strong stance on this format, you should always check the formatting guide for the journal you are submitting to.
Analyze Your Audience
Certain types of readers may draw their conclusions directly from your figures, only occasionally referring to your results: readers who are in a hurry, or who are experts in your field, and hence used to interpreting similar data to yours (e.g., not just a mechanical engineer, but an expert in nanoscale heat-transfer ). However, many other readers rely on the Results to help them more thoroughly explore what you did and what you learned.
In particular, non-experts will benefit from your descriptions in the Results section. Do not assume that readers know why you chose a given method, or what a specific observation means. State your motivations and interpretations explicitly. For example, if you are reporting data that is only valid under certain approximations you’ve made, then emphasize that. Also, avoid field-specific jargon if a simpler term can be used instead.
While this isn’t your foremost concern, your results will probably be reproduced within a study (or industry) that wants to extend your results. For such studies, broader observations that don’t make it into your main conclusion can be valuable validation or jumping-off points. Eg. “After 20 tests in air, samples oxidized and became unusable, while samples tested in a nitrogen environment remained functional for at least 100 tests.” or “Stress varied smoothly with strain in the low-amplitude regime, while stress fluctuations increased due to particle rearrangements at large strains (not discussed here).”
Be judicious in what you choose to include. Don’t barrage the reader with so many details that your main point gets lost.
Tip: Ask a friend or colleague from a different lab to read your Results and help you identify unexplained jargon or places where rationale needs to be stated more clearly.
Skills
Create a logical narrative, organized by figures
An excellent way to find a narrative order for your Results is to first organize your figures. Before writing your Results, decide on the set of figures that you will include in your paper. Each Figure should support a specific conclusion, and provide the information (data, schematics, photos) that the reader needs to evaluate that conclusion (see figures [link]). Rearrange your figures until you’ve found an order that develops the most logical series of conclusions, leading to your final take-home. Use this series of figures/conclusions as the outline for your Results.
Each major conclusion (which may correspond to one or multiple figures) can become the title for a subsection of your Results. This modular organization will help readers navigate your paper by quickly matching figures to Results and vice versa. (See also “Use subheadings to organize content” in Methods [link].)
Each Results paragraph has rationale, observations, and a closing
A single Results subsection typically corresponds to a single experiment (or a group of closely related experiments), and a single figure or subpanel within a larger figure. (See Structure Diagram above.) In some cases, for complex topics, this structure can be applied over an entire section instead of a single paragraph.
- Begin each paragraph with a topic sentence that states or motivates your main takeaway from a certain experiment/measurement/calculation. For example, you may use a structure like:
“Testing sample B in the same way, we observed a 10x increase in stiffness associated with emergent structural changes on the microscale,” or “We compute Z and test the above predictions by numerically solving Eq (2).”
- After the topic sentence, explain your observations and the conclusions that you derive from them in a logical order: e.g. most to least important, experimental versus control group.
- End the paragraph with a sentence that logically brings your observations together into a coherent conclusion, and, if necessary, justifies why you moved to the next experiment or hypothesis.
The only time that speculation can be included in Results is when it is necessary to explain a transition between experiments:
“Having observed data A, we speculated that mechanism B might cause phenomenon Z. Hence, the next experiment tested the activity of mechanism B by…”
Show minimal essential data
Describe all data necessary for your readers to evaluate your conclusions and no more than that; forcing your reader to parse through unnecessary details will distract them from your main message. Do not include data that are irrelevant to the given conclusion(s). Deciding which data are relevant can be tricky and often involves personal judgement. It also is influenced by journal article length restrictions – the shorter your article, the more content you might have to move to Supplementary Information or leave out.
Here are some guidelines to help you decide which data to include and exclude:
| Include | Put in Supplementary Information, or exclude |
The experiment or dataset that is the strongest proof of your conclusion.
Observations that are new in the field, but cannot yet be formed into a strong conclusion. |
|
The amount of time you spend describing an individual result should be proportional to the importance of that result to the paper’s main conclusion. It’s tempting to write more when describing a result that’s complicated or confusing, but you don’t want to fill your reader’s head with details if they distract from the main conclusion. As you write, keep reminding yourself what the most important conclusions are, and allocate the most space and detail for their supporting details.
Use appropriate style
Write your Results in a consistent tense. Many journals and fields tend to use the past tense, but it’s more important to understand what your audience expects than to stick to a hard-and-fast rule.
Remain objective. Avoid phrases like “interestingly…”, unless that interestingness can be concretely justified – e.g., the result contradicts a major hypothesis, or past findings in the field.
Resources and Annotated Examples
Annotated Example 1
Alvarado et al, Nature. (2017). 528 KB