If a picture is worth a thousand words, then a custom vector graphic1 is worth a million! From scientific figures to illustrations for a blog post, the graphics you create can captivate your audience and help convey key takeaways from your presentations and publications.
Adobe Illustrator is a powerful program for crafting vector graphics – illustrations that maintain incredibly high resolution when scaled in size – and is now free for all MIT students, faculty and staff! [see below for download instructions2] The multitude of tools available in Illustrator has made it a popular program for scientists to create compelling scientific figures; however, these tools also come with a steep learning curve, making figure design an initially daunting task. Luckily, even a moderate time investment into learning Illustrator can come with a huge payoff – you only need to familiarize yourself with a subset of tools to start making publication-quality figures!
In light of this, the MIT Biological Engineering (BE) Communication Lab and Data Lab have teamed up to create a series of blog posts to help our biologically-inspired friends get acquainted and comfortable with Illustrator. Since there are already a number of incredible resources and guides available online (see final section for some helpful examples), this blog series aims to be a BE-centric resource, with each post focusing on a specific concept. We hope that the topics we cover throughout the series will be especially useful for those new to Illustrator, while still helpful to more experienced users.
This blog post will kick off the series by covering the basics, including how to set up Illustrator on your local machine, and how to use some important tools. Future blog posts will discuss:
- Importing vectorized images from programming software to Illustrator
- Drawing schematics for experimental workflows
- Creating objects commonly used in BE labs (e.g. drawing cells and regulatory networks)
- Organizing data from large data sets into palatable figures
- And more! (Let us know what other topics might be of particular interest to you by emailing us at beclcomments@mit.edu)
Getting started with Illustrator
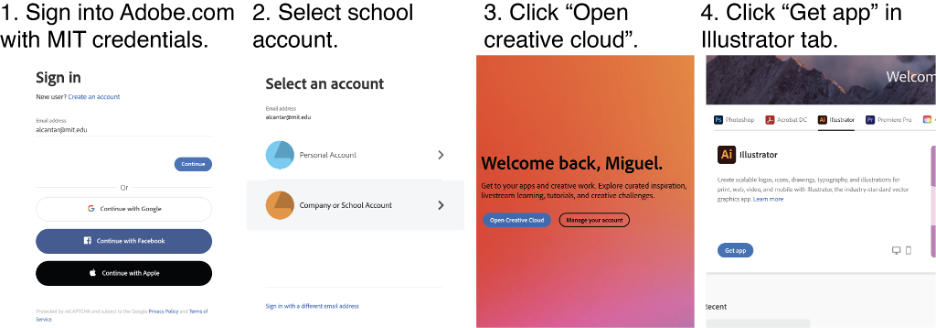
To get started, you will need to sign into the Adobe website using your MIT credentials, then download and install Illustrator.
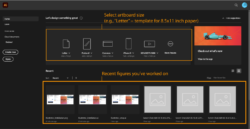
Opening the Illustrator application after installation will welcome you with the screen below. This opening page will display recent figures you’ve worked on in Illustrator, which should be empty for first-time users, and allow you to select the type of artboard3 you want to work with. An Illustrator artboard is essentially a blank canvas in the shape and size of your choice. You can see additional preset artboards by selecting “More Presets” – this will also give you the chance to create your own custom artboard. For example, you can create custom preset artboards for PowerPoint slides (widescreen slides are 960px by 540px) or A4 paper (594 by 846px), so that you are always ready to make figures for a presentation or manuscript! Illustrator uses pixels (px) as the default unit of measurement for the artboard – for reference, 1px = 1/72 of an inch. Other units are also available; just use the dropdown menu under “Preset Details” when selecting your artboard size. You can always start a new document and reselect from preset artboards by navigating to File > New.
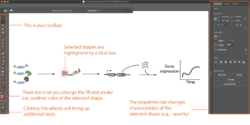
Selecting an artboard takes you to where the drawing magic happens: the Illustrator workspace. The workspace will initially be empty (we included an example figure to help highlight some features and tools) and will provide a blank canvas for your imagination to run free! (Note: if you accidentally delete your toolbar, you can always recover it by going to Window > Workspace > Reset Essentials).
Introduction to Illustrator tools
Illustrator comes pre-equipped with a massive library of tools that enable you to draw just about anything that comes to mind. The default toolbar contains most of the tools you’ll likely use when creating figures. If you can’t find a specific tool, you can always click the three dots at the bottom of the toolbar or click and hold on tool icons to display an expanded list of tools. Below, we discuss some keystone tools and their functionalities.
1. The pen and curvature tools: One of the most fundamental tools in Illustrator is the pen tool, which allows you to create straight lines / paths4 in any direction and orientation. Note that i) holding the “shift key” allows you to change the angle of the line in 45o increments and ii) you can adjust the line thickness by changing the “Stroke” property under the “Properties” tab on the right. Once you are done drawing your line, you can hit the “esc” key to disconnect your cursor from the line. If you initially can’t see the line you just drew, make sure you assign a stroke5 color and increase the stroke thickness. The gif below shows a quick example of how the pen tool can be used to draw axes for a plot diagram.
The curvature tool is very similar to the pen tool, and comes in handy when you are looking to draw curved lines. Like the pen tool, each mouse click will lay down a new anchor6 from which you can once again draw a new curve. Together, the pen and curvature tools are especially helpful when drawing custom shapes, or when drawing an example plot that conveys expected trends in your data.
2. Type tool: There are many scenarios in which including text in your figures is helpful, such as when labeling key steps in illustrations of experimental workflows, or when annotating / labeling plots. In Illustrator, the type tools let you include text anywhere on the artboard. You can then change properties of the text (e.g. font size and type) in the “Character” section under the “Properties” tab on the right. In the gif below, we also copy-and-paste text (as you would in any word processing program) and rotate the text using the rotate tool. Note that the rotate tool also lets you rotate in 45o increments by holding the “shift” key.
(Note: In this gif, we used “command + c” and “command + v” to copy and paste text. This would be “ctrl + c” and “ctrl + v” on a Windows computer. Additionally, we use the keyboard shortcuts “v” and “r” for activating the selection and rotate tools, respectively.)
3. Align and distribute tools: The align tool can help ensure multiple plots or drawings you have are perfectly aligned in any orientation (e.g. left-aligned, center-aligned, right-aligned, etc.). This can be especially useful when creating a figure with multiple panels and you want to make sure figures in different panels are well-aligned. By default, the alignment is “anchored” by the most extreme object you have selected; for example, if you left-align several objects, they will be aligned to the left-most object you have selected. When multiple objects are selected, clicking any one object assigns it as the key object to which the other objects are aligned. The key object is denoted by a thicker blue outline.
Additionally, you can make sure the spacing between multiple objects is exactly the same using the distribute tool. The gif below shows how the align and distribute tools can be used together to add tick marks to a plot diagram.
The “Show Grid” and “Snap to Grid” functionalities – which you can toggle in the “View” menu – are also helpful for creating pixel-perfect alignments throughout your artboard.
4. Polygon tool: You can create pre-made shapes using the polygon tool. Once you have the shape tool selected, you can click-and-drag to change the size of the shape. Additionally, using the “up” and “down” arrow keys allows you to increase or decrease the number of sides on your polygon, respectively. (Note: the rectangle, ellipse, star, line segment, and polygon tool are all under the same toolbar icon – you have to click and hold one of these icons to see the full list of tools.). You can change the fill7 and stroke color of your shape in the toolbar.
(Note: In this gif, we use the keyboard shortcut “v” to activate the selection tool.)
Outro
We hope this blog post was helpful in getting you familiarized with Illustrator. As with most things, the more you practice, the more comfortable and adept you’ll become at making your own figures. Learning to articulate your thoughts with a custom illustration is definitely worth the time-investment, and will help improve how ideas in your papers and presentations are conveyed.
As we mentioned before, Illustrator has a lot of cool tools and functionalities – much more than we can cover in a few blog posts! So, we encourage you to check out some helpful online resources that can help refine your Illustrator skills and teach you how to perform some specific tasks.
Lastly, if you ever need help with figure design or communicating your work, we encourage you to schedule an appointment with the MIT BE Communication Lab.
Encyclopedia of Illustrator resources relevant to BE
- Written guides
- Creative Bloq: a series of short tutorials to get you familiar with the many tools available in Illustrator
- Raj Lab guide: introduction to the basics of Illustrator, specifically geared toward scientific figure making
- Carter Lab: step-by-step guide of specific examples of scientific figures
- Youtube tutorials:
- Illustrator basics for beginners
- Video series geared specifically for scientists
- Adobe courses (1-2 hours):
Footnotes
- Vector graphics: Artwork made up of a series of points defined by coordinates in Cartesian space. The main advantage of vector graphics – as opposed to raster graphics like those stored in PNGs and JPGs – is that they can be scaled to any size without any loss in quality, allowing us to reuse artwork, schematics, and figures across multiple projects, from presentations to papers, even to business cards.
- Adobe Creative Cloud: You can access Adobe Illustrator through the Adobe Creative Cloud suite. Download by signing into the Adobe website using your MIT credentials, and install Illustrator through the Adobe Creative Cloud app. You can also install a series of other Adobe applications, including Photoshop, Lightroom, Premiere, and more!
- Artboards: Canvases upon which to draw your figures. Can be sized appropriately for each individual project, such as when a conference has a specific poster size. Using the Artboard tool, we can edit the size/shape of our artboards, as well as add additional artboards into the same Illustrator file – for example, when designing multiple figures for one paper.
- Paths: A series of points (called anchor points, see below) connected by line segments. All of our vector graphics will consist of different open (i.e. lines) or closed (i.e. shapes) paths. Each path can be broken down into its fill and stroke (see below), each of which can be changed separately. Use the Direct Selection tool to select an individual path within an object for editing.
- Stroke: Refers to the outline along each path. Defined by stroke weight, which sets the thickness of this outline, and stroke color. Note that, as with fill color, stroke color can be set to “None” or transparent. You can change other properties in the Stroke panel (Window > Stroke), including adding arrowheads and converting the stroke to a dashed line.
- Anchor Points: Set of points that define each path. Each point has a set of two “control handles”, which are tangent lines that define the curvature of the line segment between adjacent anchor points. The position and control handles of each anchor can be controlled to precisely define the shape of each path. To reshape a path, use the Direct Selection tool to select and move an individual anchor point.
- Fill: Refers to the space enclosed within a closed path. Fill can be assigned a solid color, different patterns (e.g. gradients), or “None” (transparent, not to be confused with white).
Blog post written by Anna Le, Caleb Perez, and Miguel Alcantar.
Published Sept 2021.