Criteria for Success
- Findings and direct consequences are described clearly and without speculation.
- Findings are presented in a concise, narrative flow with no logical leaps.
- The Results build to a take-home message.
Structure and Organization
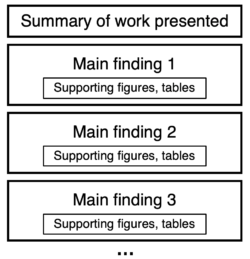
The organization of the Results section of a paper is often field-dependent. In experimental research fields, such as in Electrical Engineering, you will find the section organized as in the diagram below. The section is divided into subsections that each consist of a set of figures highlighting one major finding.
In many subfields of computer science, the organization differs. For algorithmic and systems research, the section focuses on verification and may include figures and tables reporting performance. Consequently, the section may be named “Evaluation,” “Experiments,” or “Applications.” Similarly, each major finding may be given its own subsection. For theory work, the Results section may be comprised of theorem statements.
The key is to know your audience and understand the conventions of your field. In this article we give general guidelines on papers with Results presented in the form of experimental findings and system or algorithm verification.
Identify Your Purpose
The goals of the Results section are:
- Experimental work: to describe and explain the data that you obtained with your methods, as objectively as possible, in a narrative form with supporting figures and to communicate a take-home message based on that data;
- Algorithmic and systems work: to validate the methods presented as objectively as possible using supporting figures and tables, often comparing to prior work, and to communicate a take-home message about your method;
- Theoretical work: to present the main theorems and communicate a take-home message about the corresponding implications. Depending on the state of prior work, this section might include a comparison with state-of-the-art results.
While your figures and tables give your readers the opportunity to directly examine your findings and draw their own conclusions, the Results section offers more support for the process of interpreting findings. This section explains the rationale of experimental work or validation methods, highlights important findings, and states the conclusions of your experiments or derivations. Speculation and extended interpretations belong in the Discussion, not in the Results. In some bodies of work, the Results section is as straightforward as simply stating the results of the work and leaving conclusions to the discussion section.
Content
The contents of the Results section depends on the nature of the work. Within EECS, the division is often as follows:
- Experimental work: describes data obtained from your methods. Data are usually presented in the form of figures, and each figure supports a major conclusion.
- Algorithmic and systems work: focuses on describing why your system or algorithm is better than prior work. Results are often presented in the form of figures and tables outlining performance and comparisons to other work. The Results section often starts with a subsection outlining in detail the verification setup, which includes experiments run, datasets used, and methods compared with.
- Theoretical work: contains theorem statements and proofs which may be split into multiple sections organized by topic.
Analyze Your Audience
The Results section of your paper is intended to present the results of your work in the form of figures, tables, or theorems in a concise flow. For theoretical work, the section is for readers who want to get the most technically accurate version of a theorem statement without knowing the details of the proof. For other works, the Results section is primarily intended for readers who don’t feel confident analyzing and drawing conclusions from your findings based on figures and tables alone, or who prefer verbal information in addition to visual. Certain types of readers—including those with limited time and experts in your field, narrowly defined (e.g., photovoltaic materials and devices, not electrical engineering)—may draw their conclusions directly from your figures and tables, only occasionally referring to the written text. Therefore, figures and their captions should be self-contained. However, many other readers rely on your Results section to fully understand what you did and what you found.
Non-experts will benefit the most from the explanations in your Results section, so do not assume that readers know the rationale for a particular method or that the meaning of an observation is self-evident. State your motivations and interpretations as explicitly as possible.
It’s often helpful to ask a friend or colleague from outside your sub-field to read your Results section and point out undefined jargon or places where the reasoning could be stated more clearly.
Skills
Create a logical narrative, organized into subsections
An excellent way to find a narrative order for your Results section is to first organize your figures and tables. Before writing your Results, you should have decided on the set of figures and tables that will be included in your paper. Each figure should support a specific conclusion and provide the data that the reader needs to evaluate that conclusion (see Figures). Tables similarly support a specific performance metric, often comparing to other approaches. Each figure and its accompanying caption should stand on its own. Organize your figures logically, first focusing on the most important findings or verifications. Avoid re-stating the details of a figure in the text; the text is used to summarize the most important findings. Use this series of figures and conclusions as the outline for your Results.
Each major finding (which may correspond to one or multiple figures) can be the title for a subsection of your Results. This modular organization will help readers navigate your paper by quickly matching figures to results and vice versa.
Make sure each paragraph has rationale, findings, and a transition
A single Results paragraph typically corresponds to a single experiment (or a group of closely related experiments) or evaluation, which is presented in a single figure or table.
1. A. For experimental work, begin each paragraph of this section with a topic sentence that explains the rationale for performing the experiment. For example, you may use a structure like this:
“To answer X (question), Y (experiment) was performed, showing Z (major results).”
B. For algorithmic and systems work, when evaluating your method on a dataset or reporting performance, you may use a structure like this:
“We apply our method to A (a specific task), using B (dataset), comparing with C (state-of-the-art approaches), demonstrating D (major results or improvements).”
C. For theoretical work, present formal theorem statements and/or proofs.
2. After the topic sentence, describe your findings and, if relevant, associated conclusions in a logical order (e.g., pros followed by cons, most to least important, experimental versus control group). Emphasize quantitative findings. The level of detail in these descriptions will be field dependent; many fields simply state the quantitative finding without drawing detailed conclusions.
3. Conclude with a transition sentence that sums up your findings, and, if necessary, justifies why you moved to the next experiment or hypothesis.
Remember that the Results section should simply state your findings. Interpretations and speculation should be saved for the Discussion section. Speculation should be included in the Results section only when it is necessary to explain a transition between experiments. In these cases, it may be structured as:
“Having observed A (finding), we speculated that B (mechanism) might cause Z (phenomenon). Hence, the next experiment tested the effect of B (mechanism) by…”
Show only the most essential findings
Describe all findings necessary for your readers to evaluate your conclusions and no more. Forcing your reader to parse through unnecessary details will distract them from your main message. Do not include data or findings that are irrelevant to the conclusion. Deciding which pieces are relevant can be tricky and often involves some judgment calls. It also depends on length restrictions imposed by the journal or conference—the shorter your article, the more content you might have to move to the Appendix/Supplementary Information or leave out. Presenting the results concisely without speculation or interpretation is also essential to work with length restrictions.
Here are some general guidelines to help you decide which findings to include and exclude:
| Include | Put in Supplementary Information or exclude |
|
|
The amount of space dedicated to describing an individual result should be proportional to the importance of that result to the paper’s main conclusion. It can be tempting to write more when describing a result that is complicated or confusing, but you don’t want to fill your reader’s head with details if they distract from the main conclusion. As you write, keep reminding yourself what the most important conclusions are, and allocate the most space for details that support those conclusions.
Use appropriate style
Results should be written in past tense, but references to figures should be in the present tense.
Be as objective as possible. In addition to avoiding speculation, avoid phrases like “Interestingly, we found that…,” unless that interest can be concretely justified (e.g., the result contradicts a major hypothesis or past findings in the field).
Content adapted by the MIT Electrical Engineering and Computer Science Communication Lab from an article originally created by the MIT Biological Engineering Communication Lab.
Resources and Annotated Examples
Annotated Example 1
Docampo et al Nature Communications 2013 412 KB
Annotated Example 2
Isola et al IEEE Computer Vision and Pattern Recognition 2018 1 MB